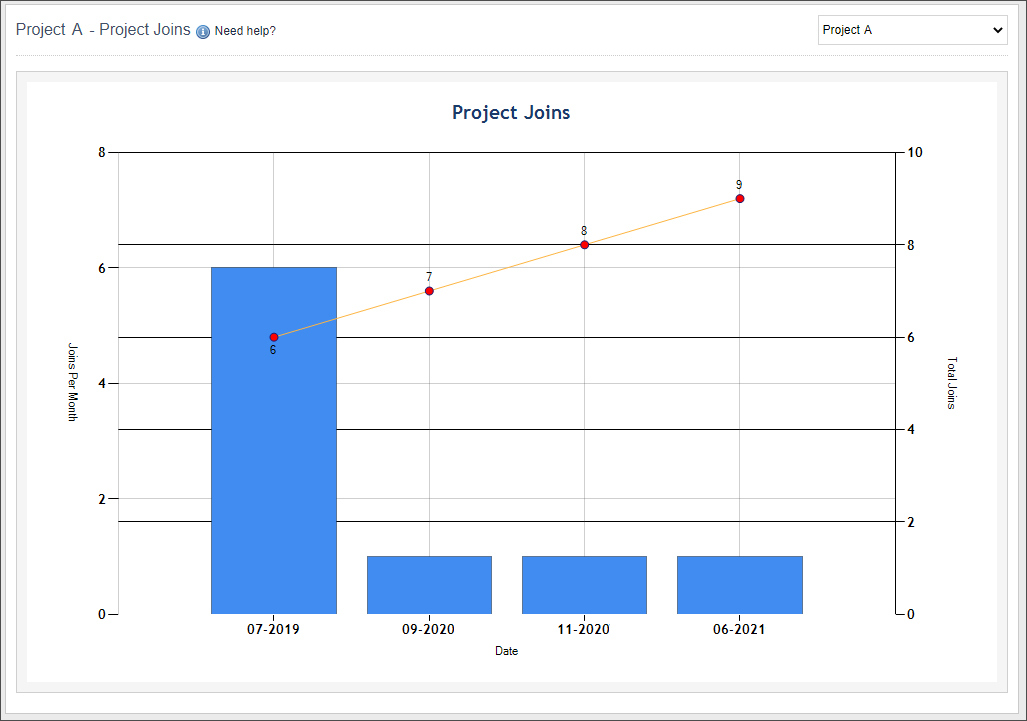
The Project Joins report displays membership statistics in your project over time. The column chart shows Joins per Month. It is overlaid by a line chart that shows the Total Joins each month.
Accessing the Project Joins Report
To access this report:
- Sign in to your GAP account by entering your Project Administrator username and password.
- On the navigation bar, hover your cursor over Reports > Member Reports, and click Project Joins on the drop-down menu.
OR
In the lower section of your GAP dashboard, in the Member Reports section, click Project Joins.
You are directed to the Project Joins page.
Charts and Columns
The Project Joins report contains a bar graph presenting project join information over time. It contains the following axes:
- Joins Per month – This axis indicates the number of joins per month.
- Total Joins – This axis indicates the cumulative number of project members
- Date – This axis indicates a linear time frame for Joins Per month and Total Joins at any point in time.
 Sample Project Joins Chart